Tunning Application Insights telemetry filtering in Optimizely
by Stanisław Szołkowski
Application Insights is a cloud-based service designed to monitor web applications, providing insights into performance, errors, and user behavior, which integrates very well with the Optimizely CMS/Commerce solution and is included in the default DXP experience. However, like any generic tool for complex systems, it can be tuned to work even better for specific platforms and projects.
What is the problem?
Optimizely as an enterprise-grade solution has multiple technical internal requests that help the platform to work correctly, but we don’t need to see them in Application Insights:
Requests count:

Similar story with SQL dependencies. Optimizely is making a lot of short internal database queries that might dominate our dashboard and statistics, while don’t necessarily help us with looking for issues or site performance information.
SQL dependencies count:

As a bonus depending on how our Optimizely solution is hosted, we will also reduce Application Insight costs by sending fewer telemetry items as well as slight performance gain for fewer items sent.
How can we improve it?
In this article, I will show how to implement two simple telemetry processors that will act as filters that can be used to exclude unnecessary telemetry data for low-hanging fruit issues shown above. These telemetries can dominate our statistics and don’t bring too much value to us.
Let’s start with the implementation of ShortSqlQueriesFilter which will filter out all SQL dependencies with execution time of less than 15 milliseconds.
public sealed class ShortSqlQueriesFilter(ITelemetryProcessor nextProcessor) : ITelemetryProcessor
{
   private const int DurationThresholdInMilliseconds = 15;

   public void Process(ITelemetry item)
   {
      if (ShouldProcessItem(item))
      {
            nextProcessor.Process(item);
      }
   }

   private static bool ShouldProcessItem(ITelemetry item)
   {
      if (item is not DependencyTelemetry dependency)
      {
            return true;
      }

      if (dependency.Success == null)
      {
            return true;
      }

      if (!dependency.Success.Value)
      {
            return true;
      }

      if (!string.Equals(dependency.Type, "SQL", StringComparison.InvariantCultureIgnoreCase))
      {
            return true;
      }

      if (dependency.Duration.Milliseconds > DurationThresholdInMilliseconds)
      {
            return true;
      }

      return false;
 }
}
Next, we can exclude certain requests using IgnoreRequestsFilter implemented below.
public sealed class IgnoreRequestsFilter(ITelemetryProcessor nextProcessor) : ITelemetryProcessor
{
   private static readonly string[] IgnoredActionNames =
   [
               "GET /episerver/health",
               "GET NotificationStore/GetUnreadCount [area/module]"
   ];

   public void Process(ITelemetry item)
   {
      if (ShouldProcessItem(item))
      {
            nextProcessor.Process(item);
      }
   }

   private static bool ShouldProcessItem(ITelemetry item)
   {
      if (item is not RequestTelemetry request)
      {
            return true;
      }

      return !IgnoredActionNames.Contains(request.Name);
   }
}
For the last step, we need to register both filters in Startup.cs
services.AddApplicationInsightsTelemetry();
services.AddApplicationInsightsTelemetryProcessor<ShortSqlQueriesFilter>();
services.AddApplicationInsightsTelemetryProcessor<IgnoreRequestsFilter>();
How do these telemetry processors work?
In general, when Application Insights collects any kind of telemetry it is processing it in a pipeline to which we can register our processors to both break the processing pipeline, let it continue, or even change/enhance the telemetry item. It is a similar pattern that is used in the .NET core for middleware registration for request processing.
Results
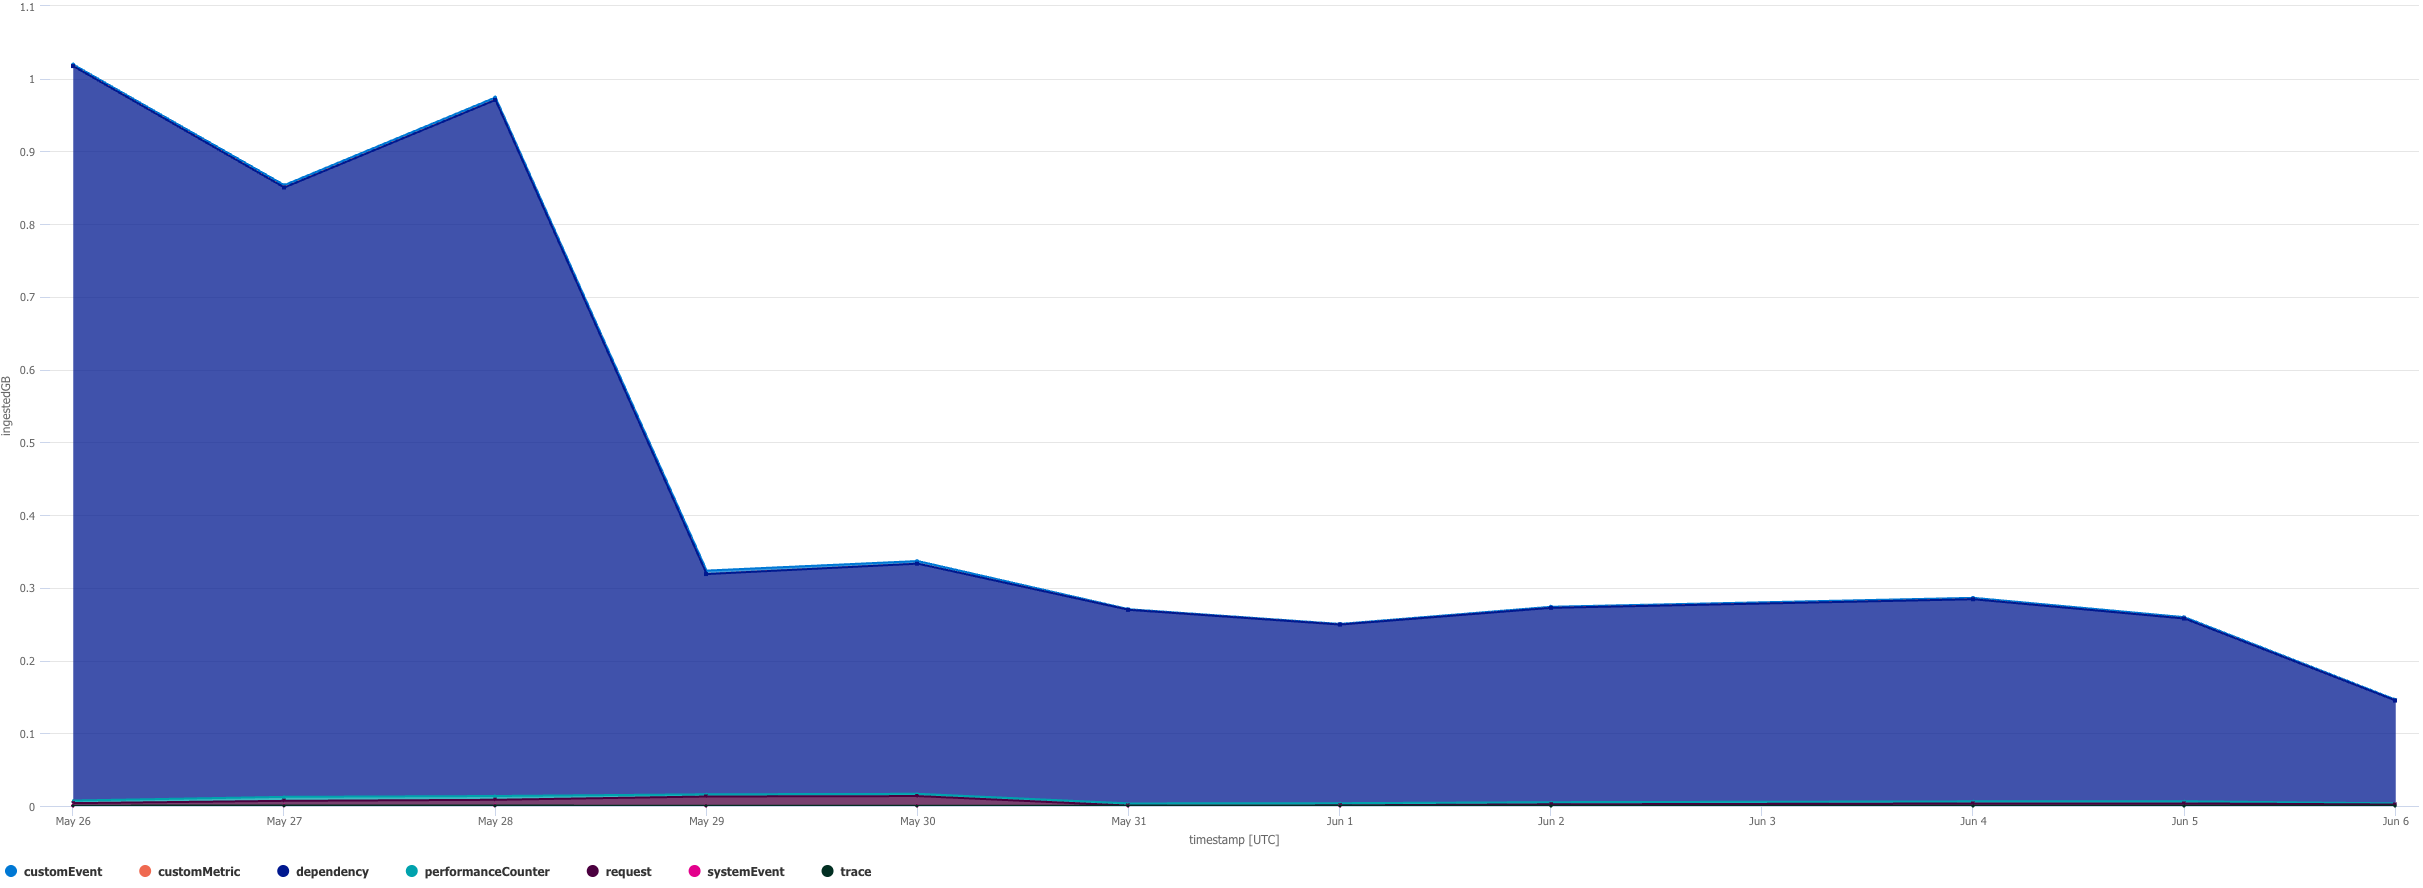
In the case shown above, after applying the above filters, we were able to filter out the technical request telemetry, as well as a significant amount of SQL dependencies that weren’t contributing much to the table.
In the below usage graph, we can easily spot when extra telemetry filters were deployed: